
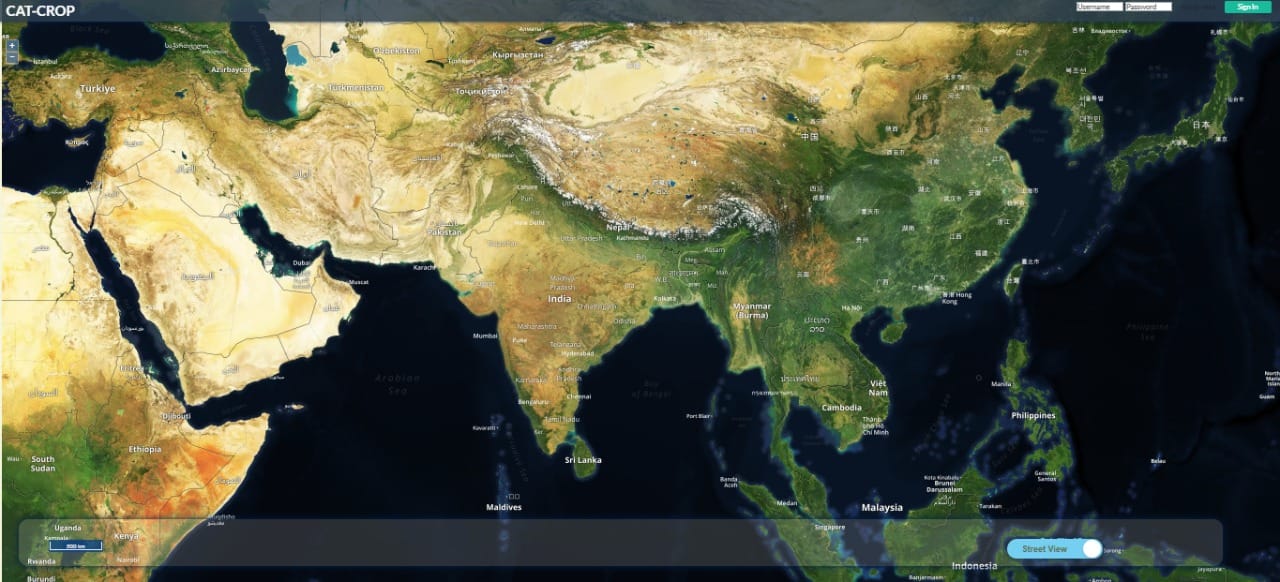
Cat-Crop for crop health analysis
Cat-crop is a web portal for visualizing crop-related data. For the below variables
- Visualize
- Similarity
- Rank and
- Comparison.
With 4 products in each category,
- Crop Yield,
- NDVI,
- Rainfall &
- Soil Moisture.

Visualize: Display the data for a specific product.
In visualizing crop yield there are 16 crops, in each of the seasons. And the data is available from 2000-2018Ndvi is available from 2001 to 2018.
Rainfall from 2001 to 2017.

Similarity: As the name suggests, it shows the selected is similar to which year in the past.
NDVI data is available from 2016 to 2018.
Soil moisture data from 2016 to 2018.
Rainfall data from 2015 to 2017.

Rank: The rank ranges from 0 – 1. Rank tells the rank of the area.
Crop Yield data for Rice and Wheat from 2000 to 2014.
NDVI from 2001 to 2018.
Rainfall from 2001 to 2017.
Soil moisture from 2001 to 2018.

Compare: Compares two selected years and display the chosen product.
In crop yield, there are 5 cops for the year 2017 and 2018.
NDVI data from 2001 to 2018.
Rainfall from 2001 to 2016.
Soilmoisture from 2001 to 2018.


