Macro sensing dashboard: An overview of the products
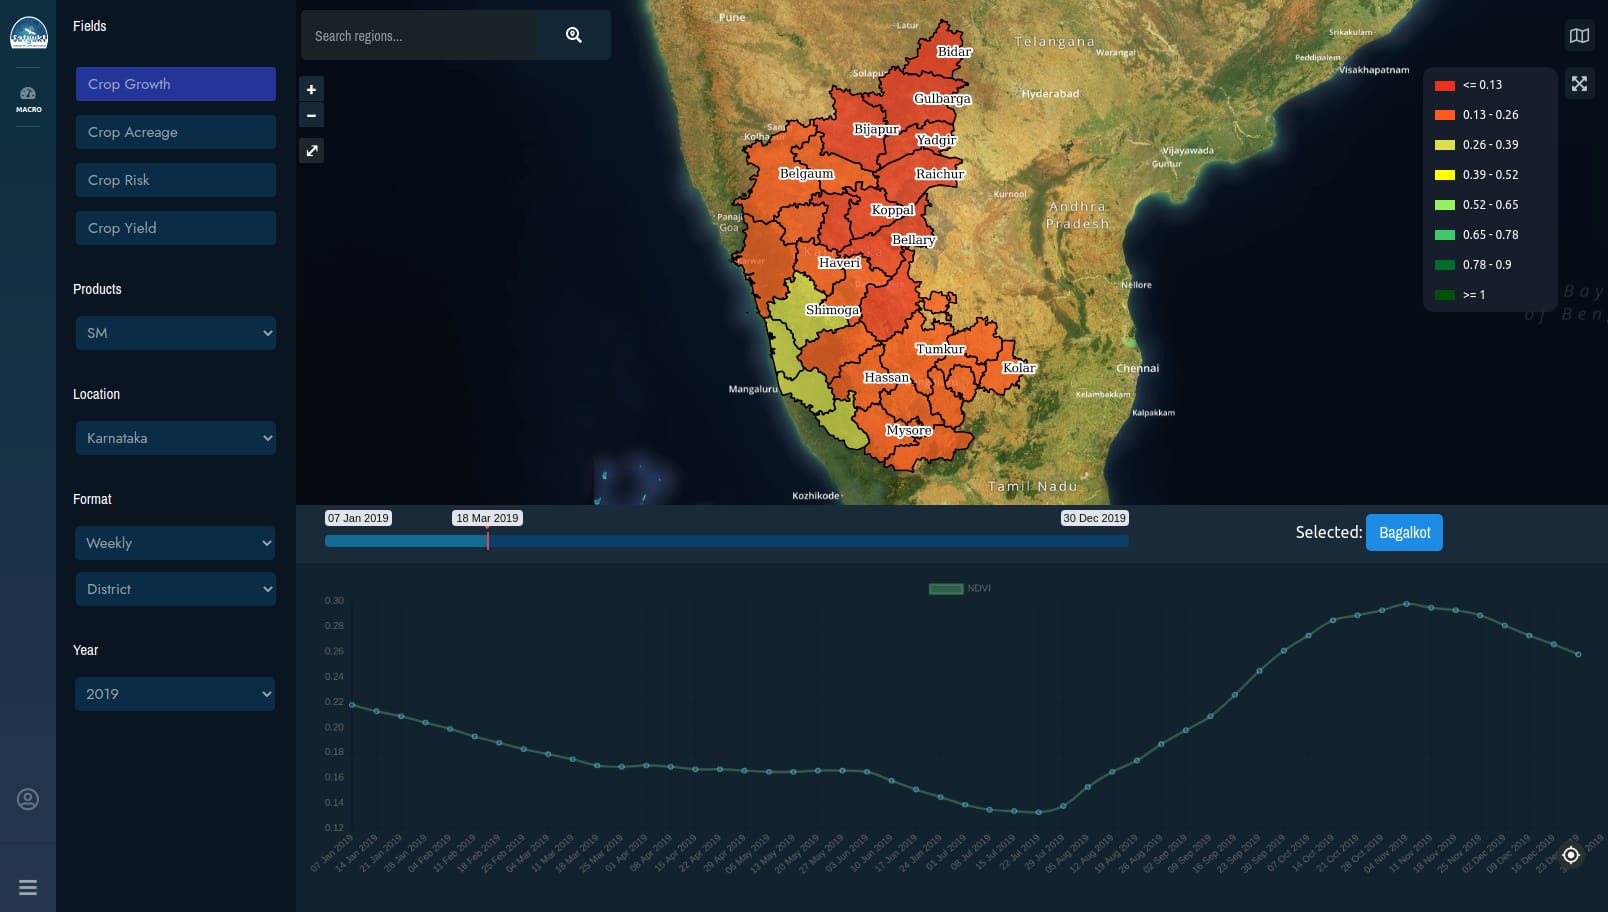
Over the years, technology has revolutionized the entire globe. We, at Satyukt analytics, are working on all-weather based satellite remote sensing to better understand and monitor environmental parameters in an efficient way. In this blog, we are going to describe the macro sensing dashboard and the products you can monitor with an active subscription. The macro sensing dashboard is an interactive web application developed to monitor various environmental parameters in real-time data. Additionally, graphs and charts are used to represent the data. So let’s discuss the various MACRO products we have in the portal.
Types of products
Crop growth
Crop growth or crop health monitoring is used to analyze the various stages of a crop with satellite-based imagery for a given duration. This data can be further monitored and compared with historical data which helps us for making proper decisions for better performance of the crop in the future.
Examples of crop growth parameters such as Normalised difference vegetation index aka NDVI, Soil moisture, Evapotranspiration, and Rainfall, etc are used to identify the crop growth for a particular duration.

Crop acreage
We are living in the ever-changing technology evolution, where business owners and corporate teams are finding new ways to generate more revenue from their business models. Our crop acreage analysis is useful for those agro-business domains where crops are the major raw material to develop a product. Here, we analyze and monitor the various parameters of a plant with historical data to help the businesses to generate more revenue.
Example: Finding the acreage and density of coconut trees for a given location to help the business to decide buying coconut from a suitable location.

Crop risk
Natural calamities are one of the biggest dangers mankind faced and yet controlling it is difficult. However, with proper monitoring and analysis, we can always control the impact and the loss of which may occur. Our experts in flood modelling and drought analysis prepared efficient algorithms to determine the impact of the calamities so that the government and other agencies can take the proper decision much faster and efficient way.

Crop yield
It’s difficult to determine the quality of a crop by monitoring one parameter as we did in crop growth monitoring. However, with crop yield, we can identify the health of a crop with maximum accuracy as it covers all of the major crop parameters.


Has one comment to “Macro sensing dashboard: An overview of the products”
Prof. (Dr.) Deepak Lal - October 13, 2020
Are you trying to assess crop health via estimating crop yield? Atleast this is what I understand from your write up in ‘Crop Yield’. Well, if I were you, I would use various remotely sensed crop health predictors/indices to monitor crop health and take
remedial measures as appropriate to ensure better yield.