Air Quality Index (AQI) after Diwali is “choking”: The National capital is gasping for fresh air
According to the central pollution control board, the country’s Air quality index is alarmingly high with a gauge reading of “Very Unhealthy” mostly in northern parts of the country. On November 7, the country celebrated “Diwali” by bursting crackers beyond the deadline set by the supreme court, most of the places of the country, especially the capital recorded a surge in the air pollution 1. Delhi’s air pollution is a toxic mix of vehicular exhaust, smoke from stubble burning in the nearby states of Punjab and Haryana, coal-fired power plants, industrial emissions, road dust and sand from the construction sites. The pollution is further intensified by the winter weather pattern and hemmed in by the Himalayas to the North. The air quality Index above 300 is considered as “Hazardous”, Delhi recorded an AQI of 574 Thursday Morning 2.
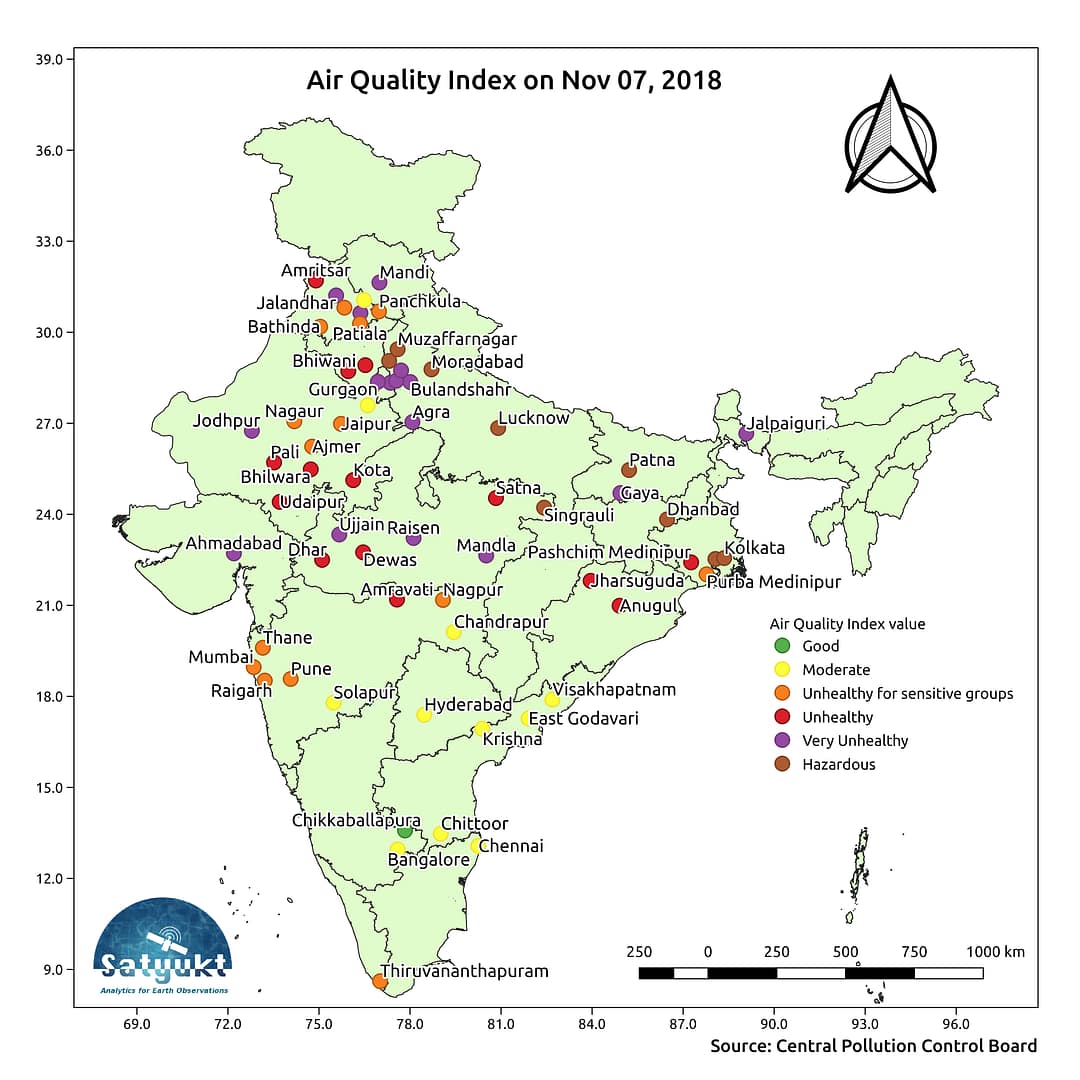
The above map shows the AQI recorded at the different monitoring stations. The map is prepared using the data published by the central pollution control board. As it can be inferred from the map that the northern parts of the country record higher Air Quality Index compared to the southern regions. The index of Air quality presented in the map is as follows3:
- Good (0-50) – Minimal impact
- Satisfactory (51-100) – Minor breathing discomfort to sensitive people
- Unhealthy for sensitive group (101-200) – Breathing discomfort to the people with lungs, asthma and heart diseases
- Unhealthy (101-200) – Breathing discomfort to most people on prolonged exposure
- Very Unhealthy (200-300) – Breathing discomfort to most people on prolonged exposure
- Hazardous (301-400) – Respiratory illness on prolonged exposure
- Severe (401-500) – Affects healthy people and seriously impacts those with existing diseases
Air pollution can be controlled by a strict administration and proper monitoring methods. For which, identifying the causes of pollution is important which is tedious and time taking if done manually. Satellite images can play a prominent role in identifying the causes of pollution spatially and temporally in near real time. These analyses will help the decision making authorities to identify the causes and culprits much easily. Satyukt Analytics Pvt Ltd, an expert in Microwave remote sensing is capable of monitoring air quality in near real time.


