
Understanding NDVI
Agriculture plays a significant role in the Indian economy. Almost 70% of rural people are integrated with agriculture. Agriculture is the most important sector of the Indian economy, as it contributes almost 18.1% of total GDP. In addition, about 43% of India’s geographical area has been engaged in the agricultural sector.
Today, real-time, reliable, and accurate crop development is essential to assist the transition towards maximizing efficiency in sustainable farming. Satellite imagery provides valuable insights into the crop growth monitoring without stepping out your foot in your farm.
Vegetation Index (VI) is a mathematical combination of two or more such spectral bands that enhances the contrast between vegetation (having high reflectance) and bare soil, man-made structures, etc. as well as quantifies plant’s characteristics, such as biomass, vigour, density, etc. It is important for the agricultural sector for monitoring a particular farm.
Basically, the green pigment called chlorophyll in a healthy plant absorbs most of the visible red light, while the cell structure of a plant reflects most of the near-infrared light.
Normalized Vegetation Index (NDVI ) used to monitor the condition of vegetation health globally. Its value ranges from -1 to +1 which indicates the health of green vegetation. If NDVI value close to -1 indicates the possibility of deep water, close to zero means less or no vegetation and close to +1 (0.8-0.9) indicates the highest possible density of green leaves.
NDVI=NIR−RED/NIR+RED
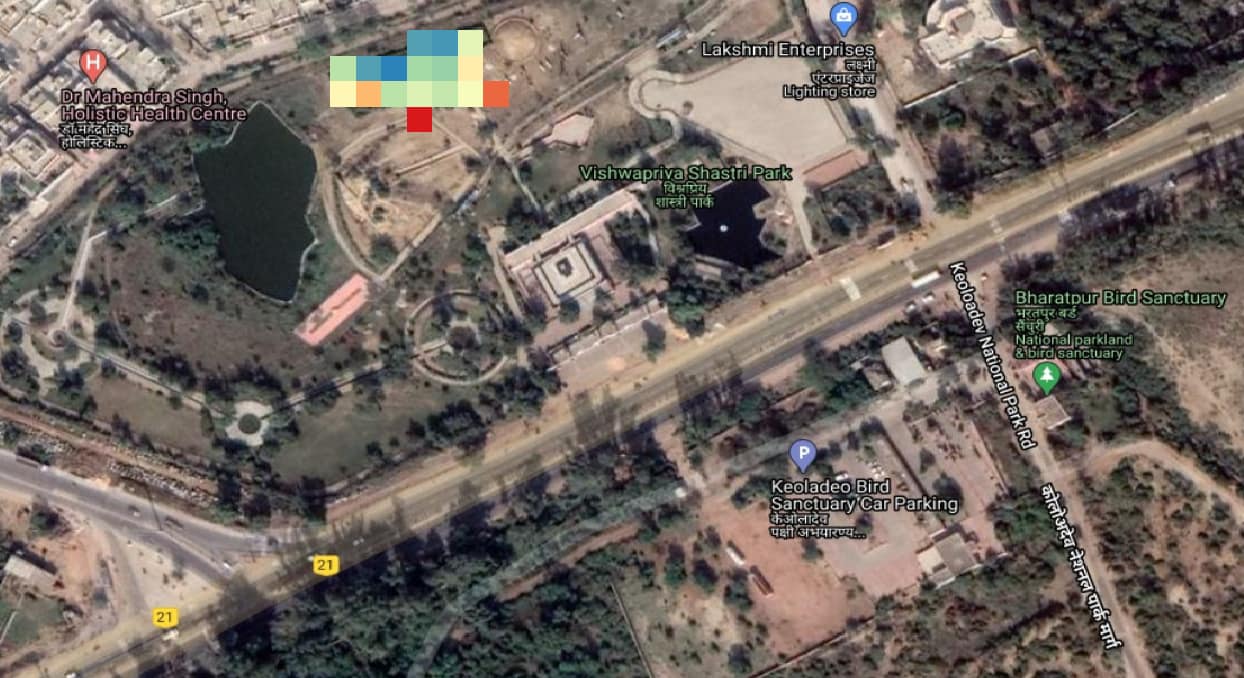
The above figure shows the NDVI image for a farm in Bharatpur, Rajasthan depicting colour variation of NDVI in the farm. Here red-orange-yellow shade indicate barren land or dead/sparse vegetation, and all shades of green are a sign of normal to denser vegetation cover.


