What is NDVI and how can it be used for better agricultural management?
Normalized difference vegetative index is a measure of the health of crops by using remote sensing technique. To determine a healthy patch (green patch) of land, researchers must observe different colours (wavelengths) of visible and near-infrared sunlight reflected by plants. Many different wavelengths make up the spectrum of sunlight. Certain wavelengths are absorbed, and certain wavelengths are reflected when sunlight strikes any object on the ground. The pigment in plant leaves called chlorophyll (directly related to green patch) strongly absorbs visible light (from 0.4 to 0.7 mm – red colour) for use in photosynthesis. And the cell structure of the leaves, strongly reflects the near-infrared light (from 0.7 to 1.1 mm). These two wavelengths show direct effect based on the amount of leaves a plant has. Thus, these two wavelengths are used to calculate NDVI which is calculated based on the ratio of their difference to their total (equation 1).

where, NIR – reflection in the near-infrared spectrum and RED – reflection in the red range of the spectrum
The value of NDVI ranges from -1 to +1 where the values less than 0 do not have any importance in terms of crop monitoring. Negative values mostly correspond to water and snow, sometimes it can be due to the cloud. Values close to zero are formed primarily from rocks, roads, buildings and bare soil. The values from 0.2 to 0.9 correspond to varying health of plants. Higher values corresponding to large differences between the RED and NIR recorded by the sensor which indicate highly photosynthetically active vegetation. Low values mean little difference between the values of RED and NIR signals. This is due to less photosynthetic activity and less reflectance of NIR (e.g., water reflects very less NIR). Values close to +1 (0.8 – 0.9) indicate forest areas or dense vegetation. Like sugarcane is seen having NDVI of 0.85. Crop monitoring successfully utilizes this scale to show farmers which parts of their fields have dense, moderate or sparse vegetation at any given point of time. Following can be used as scale to identify different crop growth stages

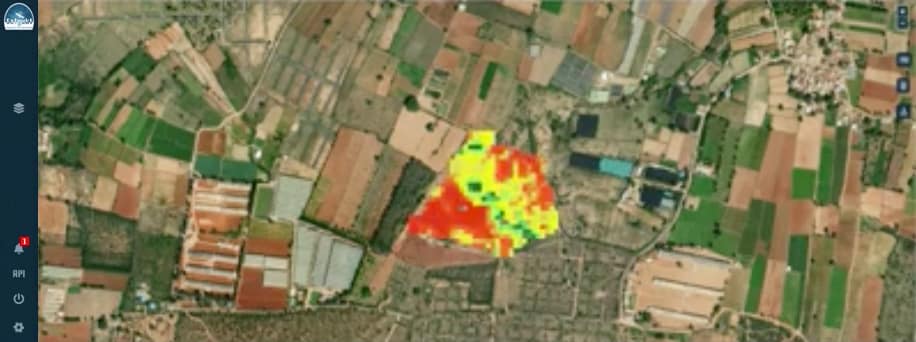
In India multi-cropping is practiced and in such cases close monitoring of NDVI changes in other words high resolution NDVI values are very important to avoid confusions due to mixed signals. Here, at Satyukt analytics we use multi-satellite data to provide NDVI at high resolution which can be used in small land holdings (< 1 ha). Based on the spatial maps of NDVI over farms, farmers can locate and attend the patches where attention is needed, using the micro-sensing portal of Satyukt Analytics.
Satyukt Micro Sensing portal helps to access the viewer the following benefits:
- Visualize – To visually represent our product we offer through our web-based, API and mobile-based services
- Coverage – We not only provide data in India but also in a global scale
- Reliable – We provide accurate data so that you can easily rely on it
- User friendly – To get easy access, simple navigation is available
Contact us to register in our portal and to find out pricing details at contact@satyukt.com. We will be happy to address all your exciting questions. In the meantime, have a look at satyukt.com for more information about us.


Has one comment to “What is NDVI and how can it be used for better agricultural management?”